Pushing digital twin technology to new heights, infrastructure professionals explored their surroundings in a stunningly realistic fashion at a recent conference hosted by Bentley Systems, Incorporated. Combining BIM, reality capture, real-time data, and other data streams, participants explored a digital representation of Singapore with engineering-level accuracy. The immersive experience was part of an iLab demonstration at the Year in Infrastructure and Going Digital Awards event in Singapore, October 11–12, 2023.
The demonstration featured a digital model of the entire country of Singapore, depicting infrastructure and other components such as energy, water, transportation, and natural elements. Individual projects from the United States and Italy were also included in the demonstration. Using a variety of interactive methods, including virtual reality headsets, Xbox controllers, and conventional computer peripherals, participants could navigate models and explore a variety of geospatial data. The demonstration illustrates how infrastructure professionals can leverage digital twin platforms to analyze, predict, and innovate in their day-to-day work.
Greg Demchak, director of the Digital Innovation Lab at Bentley Systems, likens the experience to “a single pane of glass where you can toggle on and off different layers of geospatial data and have a new way of navigating and understanding your city or your country.” While viewing a 12’ x 8’ screen, conference attendees could virtually “fly out of the hotel and suddenly have all of Singapore surrounding them and navigate through the entire country,” said Demchak.
Sustainable Goals
Much of the demonstration was geared around the Singapore Green Plan 2030, a national initiative that seeks to advance Singapore’s sustainable development agenda. The plan includes five pillars: 1) city in nature, 2) energy reset, 3) sustainable living, 4) green economy, and 5) resilient future. It also has specific targets to plant 1 million trees, increase solar energy deployment, reduce waste sent to landfills by 30%, make 20% of schools carbon neutral, and increase the use of cleaner-energy cars.
As an example of how technology can aid energy monitoring, the demonstration showed how energy performance can be displayed on the Singapore model. The Bentley team wrote an algorithm that rendered vertical bars showing annual energy consumption at individual building locations. The geospatial context produced a more intuitive display than conventional approaches, which would likely require transferring data from a spreadsheet or database to a map.
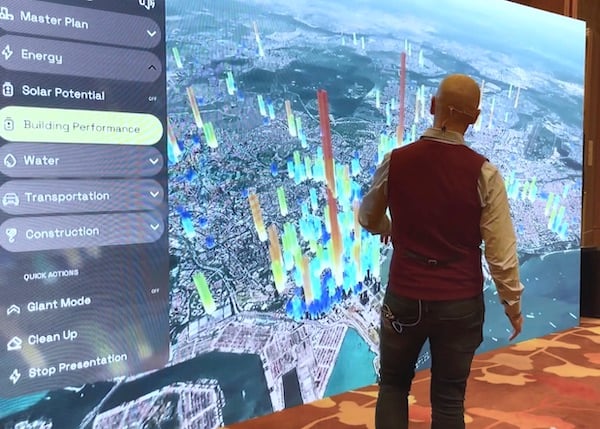
Bentley’s Greg Demchak demonstrates how energy consumption can be viewed in a digital twin with rendered vertical bars showing annual energy consumption at individual building locations. Image source: Bentley Systems.
In another application, the demonstration showed how solar energy potential can be evaluated. Using publicly available data from the Google Maps Platform Solar API, the demonstration showed how solar energy potential varied across the city of Singapore and helped identify prime solar panel locations.
Water infrastructure offered another opportunity for geospatial modeling. Using Singapore public utilities data, the Bentley team displayed water pressures at various locations in the water system and identified low pressure areas, which could be indicative of leaks or other issues.
In a transportation application, the demonstration showed how predictive modeling was used to predict ridership on Singapore’s passenger rail system. Based on population and transportation models, the digital twin model showed how demand might vary in different locations and travel directions. In another display, the condition of the rail system’s track was plotted as a line graph along the actual track location based on ground penetrating radar data.
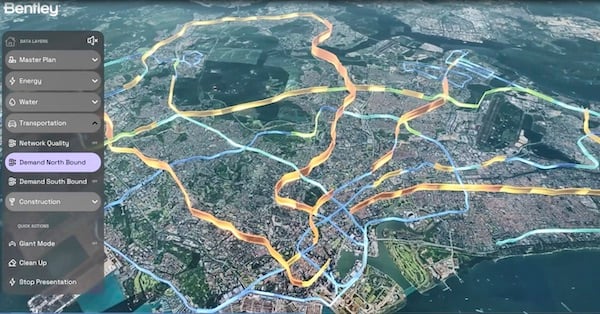
In this example, transportation demand is shown along passenger rail lines. Where the lines are blue, the rail is in less use. As it turns to orange and red, use is high. Image source: Bentley Systems.
Zoning, land use, parks, and various other data were displayed in similar ways. “As long as you can get information and some geolocation, you can produce these types of visualizations,” noted Demchak.
In a building application, the demonstration showed how a completed building can be monitored from an operational perspective. Using IoT (Internet of Things) sensor data to track parameters such as occupancy, lighting, heating, and cooling, the performance can be displayed in panels at various locations within the building. “The idea here is to link data into the digital twin and show some of the sustainability strategies,” said Demchak. “It’s a way to see if digital twin technology can be used not just during design and construction but into operations.”
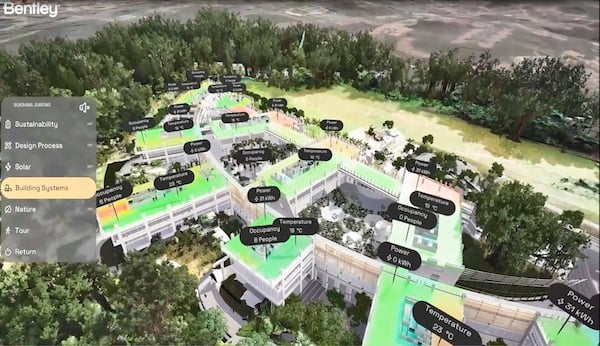
Building performance can be monitored using IoT data with live data continuously updating. Image source: Bentley Systems.
Under the Hood
The application demonstrated in Singapore is powered primarily by Bentley’s iTwin Experience and includes a variety of other tools. As an executable desktop application built on top of the Unreal Engine from Epic Games, Inc., the application uses a series of APIs to connect data into the application. The iTwin Platform pulls in 3D models and geometry. Google Maps data provides the surrounding context, along with iTwin Capture for photogrammetry and drone data. “We’re using it as a federation application to connect many sources of data, all within this one unified interface,” said Demchak.
In addition to showcasing the technological advancement, the demonstration also showed opportunities for enhanced collaboration, efficiency, and informed decision-making, according to Demchak. “The intent was to deliver on this idea that we've kicked around for a few years, this whole notion of the single pane of glass — actually surfacing many different layers of data within one context.”
The demonstration also provided participants with a glimpse of how they can leverage digital twin platforms to achieve sustainability goals and other objectives. It perhaps provides a guide for future best practices, where technology helps guide the planning, design, construction, and operation of infrastructure elements for greater efficiency, resilience, and sustainability.
View Bentley Systems video showing the Singapore iLab in action.


Searching for more information about Architecture, Infrastructure, and Construction?
Click here!