![]()
Before any significant infrastructure or building project can be designed, a concentrated data collection effort is needed to map existing conditions. In the past, this has typically been performed by multi-person survey crews, using a variety of equipment including transits, theodolites, total stations, and other instruments. After data collection, a significant amount of time was spent processing the data for use by a design team.
Advancements in equipment and software technology during the last decade have largely turned this process on its ear, with one-person crews often collecting data using laser scanners and GPS equipment, and then directly importing the massive point-cloud datasets into CAD environments. With these new techniques, surveyors and designers can more readily share data and often make real-time adjustments during various stages of a project.
“The collaboration level has really increased,” said Bryan Williams, portfolio manager at Trimble, a Sunnyvale, California-based provider of construction and geospatial hardware, software, and services. “The modified field and office workflows give teams the ability to see the same data in the field and the office. It puts the data in the hands of the people best suited to use it.”

Image source: Vasily Merkushev/stock.adobe.com
Capturing Data and Imagery
The new workflows are finding uses in a wide range of projects, including highways, buildings, industrial facilities, and water and wastewater treatment plants. Laser scanning, mobile imaging, and GPS technology are used throughout project lifecycles, from initial data collection through design and construction, and even into operations and maintenance.
When Ferber Engineering Company, Inc. (FEC), a Rapid City, South Dakota-based consulting firm, was tasked with evaluating more than 1,000 miles of roadways, the firm leaned heavily on mobile imaging and GPS technology to gather data. The South Dakota Department of Transportation (SDDOT) and Pennington County were seeking to bring roadway signing and delineation up to current standards and reduce vehicular road departure crashes. To help accomplish this goal, FEC needed to survey and assess roadway signage and curvature, then deliver a set of biddable design plans to upgrade signing and improve roadway safety.

Mobile imaging was used to collect data on more than 1,000 miles of South Dakota highways. Image source: Ferber Engineering Company, Inc.
FEC used a Trimble MX7 vehicle-mounted imaging system to capture 360-degree, geo-referenced images of the roadways, including more than 2,700 horizontal curves and 20,000 signs and delineators. The team also connected to a NOAA Continuously Operating Reference Station (CORS) GPS station to obtain correctable location data and achieve accuracy within a fraction of a foot. The 360-degree street level imagery was then available for the entirety of the project, which provided “tremendous value,” according to Linda Foster, FEC’s project manager. “We needed to evaluate the existing signage, where it was placed, its age and condition, and then also during design, figure out if those assets were in the correct location,” she said.
With an accurate inventory of signage and roadway imagery, FEC could identify potential improvements to be included in design plans. “Highway signage is proven to be one of the single, most effective ways of preventing road departure crashes,” noted Foster.

Combining survey data and GIS allowed FEC to identify locations for sign improvements. Image source: Ferber Engineering Company, Inc.
For curve evaluation, FEC used a digital ball-banking system integrated with GPS. The ball-banking system uses an electronic measuring device to evaluate inclination and other factors that affect safety and comfort of vehicle occupants traveling through roadway curves. Traditional methods use a weighted ball floating in a glass tube and require multiple passes through the curve to obtain sufficient data. The digital system “allowed us to more safely evaluate those horizontal curves, because we could go all the way through the curve [in one pass]. With traditional means, you would have gone through that curve four times.”
After capturing field data, FEC used a wide array of geospatial tools within the Esri ArcGIS platform to analyze and visualize information. With much of the plan content consisting of tabular data, FEC was able to produce more than 90% of the plan set from the GIS environment, using an AutoCAD template for sheet borders and Adobe software for PDF editing, according to Foster.
Treatment Plants Benefit
AEC professionals are also finding new uses of laser scanning inside existing buildings, such as water and wastewater treatment plants. LandTech Consultants Inc., a Westford, Massachusetts-based engineering and surveying firm, relies heavily on laser scanning to build 3D models of existing facilities and link those models to operational data.
On a demonstration project in California, LandTech performed a comprehensive walk-through LIDAR survey of a wastewater treatment plant using Leica scanners. Accompanied by a plant technician, LandTech personnel obtained point-cloud location data for assets such as pumps, valves, and piping, and tagged the assets with additional attributes, such as manufacturer, size, and maintenance history. The point cloud information was processed to build a 3D model using Autodesk Recap Pro and Revit. The model data was then integrated with GIS data using ArcGIS and made available to plant technicians for operational uses.


On a demonstration project in California, LandTech used laser scanning to obtain point-cloud data, build a 3D model and integrate the model with GIS data. Images source: LandTech Consultants Inc.
Improvements in computer hardware and software have simplified processing of massive point cloud files and enabled more integration of 3D models and GIS data, according to Zachary Jaffe, LandTech GIS coordinator. “You're using the point cloud as your true data source, and from that you can get multiple deliverables, [including 2D plans, 3D models, and asset inventories],” he added.
With point cloud files sometimes exceeding 70GB, the technology improvements have been key to success in merging modeling and GIS data, said Jaffe. The importing of point cloud data into a CAD environment previously required multiple steps to process the data, but is now essentially accomplished by just selecting a point cloud file type within AutoCAD, he added.
As modeling and GIS data become more integrated, owners are able to better manage their facilities using building information modeling (BIM), with key information tagged to various plant assets. Jaffe has seen a growing demand for BIM in these settings. “Our clients have been asking, ‘How can we integrate these models with our GIS for asset management and improve field operations?’,” said Jaffe. “So, this is really extending the life of these models that were originally created for documentation or design.”
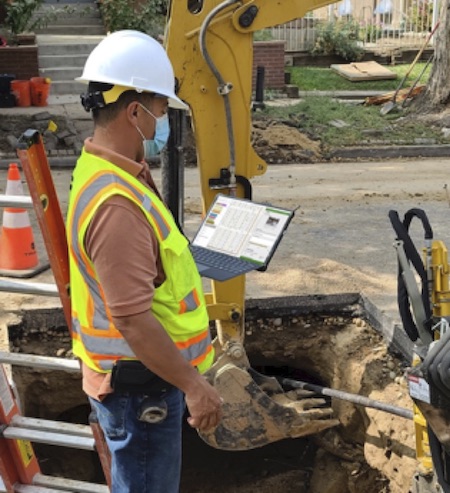
LandTech has also been using augmented reality to view digital data overlaying physical assets in the field. Using vGIS, a mobile app that combines spatial data from multiple sources into geo-referenced visual displays, field personnel can walk through a job site and view modeled data superimposed over physical assets in real time. Users can even view subsurface components such as water distribution pipes and valves at ground level in relation to above-ground features such as fire hydrants. Users can click on features to view the associated attributes, pending work orders, and other facility information.

Using mobile devices, field personnel can view modeled data superimposed over physical assets in real time. Image source: LandTech Consultants Inc.
Trimble’s Williams sees the integration of models and field data changing the way surveyors, designers, and builders interact. As examples, he cited use of Trimble X7 3D laser scanners with the company’s FieldLink software to visualize point-cloud data in the field and make real-time adjustments to high-precision concrete placement, mechanical piping installation, structural steel erection, and other construction activities. “You can see the differences between design data and actual conditions,” he noted.

Integration of models and field data enable visualization of point-cloud data in the field and real-time adjustments to construction activities. Image source: Trimble.
The recent changes in data collection technology are likely to continue and increase collaboration between design and construction teams. And, with firms under constant pressure to deliver high-quality work on tight schedules, the additional capabilities should be welcome additions to the toolboxes of AEC professionals.
Next Time
How are you using GIS, GPS, and imaging technology in your day-to-day operations? What do you want to know more about? Drop us a line and let us know at editors@cadalyst.com.


Share This Post