When conducting large-scale planning and engineering for campuses, cities, and other multi-building facilities, the amount of data can be staggering. Massive volumes of information from paper plans, CAD drawings, ground and aerial surveys, and various other sources must be integrated and organized for access by a wide range of users.
Digital technology is helping industry practitioners tackle these gargantuan tasks, as the fields of GIS, CAD, BIM, and digital twins expand and overlap, creating more opportunities to share data and improve interoperability. Emerging techniques in these fields were on full display at the 2022 Year in Infrastructure and Going Digital Awards, hosted by Bentley Systems in London November 14–15, 2022.
While the competition included projects across the civil and infrastructure world, in this article, we’ll focus on three finalists from different parts of the world working in the areas of facilities, campuses, and cities. These finalists presented innovative uses of technology, with a variety of data sources, techniques, team participants, and project stakeholders.
The finalist projects included Kaunas Digital Twin in Kaunas, Lithuania—a digital twin of the city’s built environment; Project PLATEAU—Japan’s largest 3D city model, encompassing more than 50 cities; and Maps@SYD—a cloud-based, self-service portal supporting facilities planning and operations at the Sydney Airport in Australia. In the end, Maps@SYD emerged as the winner, though all three projects provided a rich sampling of technologies and examples of positively impacting the surrounding communities and environments.
Kaunas Digital Twin
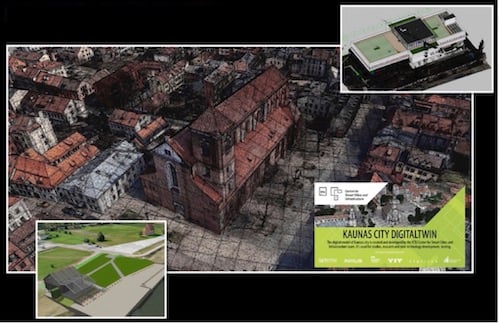
In Kaunas, Lithuania, a Kaunas University team partnered with other organizations to develop a comprehensive digital twin of the city’s infrastructure, with emphasis on the university campus and two other key areas of the city. The team combined BIM, GIS, CAD, and reality capture data to help build the digital twin. To integrate multi-sourced data, the team used Bentley Systems’ OpenCities Planner as the main platform, along with ContextCapture, iTwin, LumenRT, MicroStation, OpenBuildings Designer, and other products to generate a reality model of the city and campus.
The Kaunas Digital Twin combined data from numerous data sources to build a comprehensive model of the city’s built environment. Image source: Centre for Smart Cities and Infrastructure, Kaunus University. Click image to enlarge.
Benefits of the Kaunas digital twin extended across multiple disciplines, according to Darius Pupeikis, head of the Centre for Smart Cities and Infrastructure at Kaunus University. “A digital twin raises awareness for the construction industry, municipalities, and academic colleagues,” he said. “[The participants] can see interdisciplinary contributions.” Notable products of the work include flood simulation modeling, energy and air quality monitoring, and widespread geometric modeling that aids planning and construction efforts. Detailed modeling of a complex MLab building project enabled the team to augment the new building’s digital representation with live IoT data to analyze indoor climate conditions, helping optimize energy consumption. Cadalyst author Andrew G. Roe interviewed Darius Pupeikis at the event to find out more:
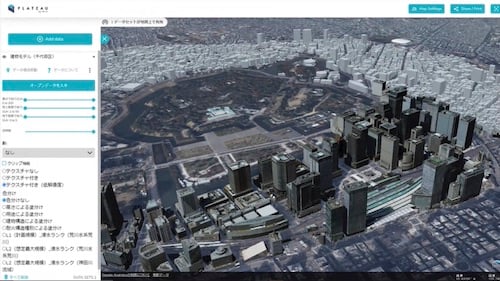
Project PLATEAU provides reality modeling for more than 50 cities in Japan. Image source: Kokusai Kogyo Company, Ltd.
Project Plateau
Hundreds of cities in Japan will benefit from the largest-scale 3D city modeling effort in the country. Project PLATEAU is developing digital twins of 56 cities and plans to expand this effort to 500 cities by 2027. A team led by Kokusai Kogyo Company, Ltd. compiled data primarily from automobile-based LiDAR surveys and created geometry in MicroStation from the point cloud data. The team developed models to a Level of Detail 3 (LOD3) on a scale of 1 to 4, with 4 being the highest LOD. In Numazu City, the detailed modeling enabled development of an automated driving system for electric buses using a visual positioning system.
“We created extremely high-definition city models in this project,” said Tatsuya Muraki from Kokusai Kogyo Company, Ltd. “These models are a first in our industry, as well as in our company.” In addition to supporting the automated bus system, the team’s efforts also aided solar energy modeling and provided detailed visualizations throughout multiple cities, promoting smart city management and sustainability, he added. Future plans include adding even more detailed features, such as fences, signs, and road markings, to further aid automated driving systems. Cadalyst author Andrew Roe interviewed Muraki at the show. Hear more directly from the company:
Sydney Airport Wins Award
At the Sydney Airport, the creation of a cloud-based, self-service portal of facilities information has proven even more valuable than initially envisioned. In addition to being used by a wide variety of airport staff, Maps@SYD has been embraced by law enforcement and other stakeholders. Integrating a wide variety of data from multiple sources, the system provides real-time collaboration and 3D viewing capabilities for planning, auditing, and facilities management.
“It’s essentially Sydney Airport’s version of Google Maps,” said Michael Smith, GIS specialist at the airport. “It enables a diverse range of users to navigate their way around the campus.”
With three runways, three terminals, more than 400 buildings, and a footprint spanning 906 hectares, the Sydney Airport is essentially a dynamic mini-city of its own, noted Kim Cohen, team lead for Maps@SYD. The system was developed to meet airport officials’ need for easy access to spatial and survey information in supporting facilities planning and operations.
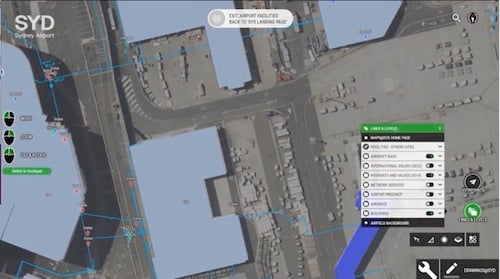
Maps@SYD can be used to access a variety of surface and subsurface data. Image source: Sydney Airport. Click image to enlarge.
Using Bentley Systems’ OpenCities Planner, along with ProjectWise, the iTwin Platform, and various other applications, the Maps@SYD team integrated different types of financial and asset data and metadata, models, and documents from multiple systems. The integration provided real-time collaboration and 3D viewing capabilities for planning, auditing, and facilities management. Maps@SYD users can access data regarding buildings, subsurface utilities, airspace, noise contours, and a variety of other information.
As an example, staff can use tablets in the field to access information about each of 6,000 lights at the airport. In addition to location information, the system provides links to maintenance sheets, cabling information, and other data related to the lights.
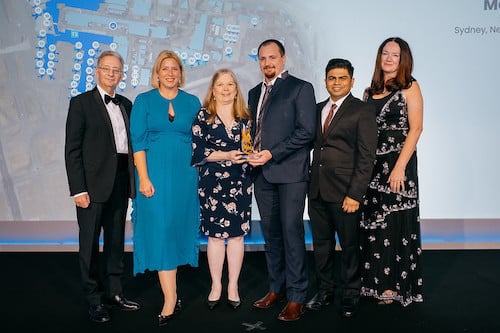
Members of the Maps@SYD team accept their award with Bentley executives (from the left: Greg Bentley, CEO Bentley Systems; Susanne Trierscheid, VP, Modeling and Facilities Engineering; Kim Cohen, Lead, Sydney Airport; Michael Smith, Airport Design Officer, Sydney Airport; Prathamesh Gawde, Senior Product Marketing Manager, Bentley; and Katriona Lord-Levins, Chief Success Officer Bentley. Image source: Bentley Systems. Click image to enlarge.
Maps@SYD information is also being used for a variety of purposes not directly related to engineering or technical applications. The Australian Federal Police, the primary law-enforcement agency at the airport, has found asset information invaluable in conducting its responsibilities related to security, emergency response, and other duties. The agency called Maps@SYD a “gamechanger,” according to Cohen, and is integrating information from the system in 2023.
Firefighters and other operational staff also rely heavily on the system’s information related to fire hydrants and other facilities. Regulatory and reporting efforts are aided by system capabilities in compiling asset drawings submitted to the Australian Competition and Consumer Commission (ACCC) for compliance checks.
Maps@SYD’s open digital environment has significantly increased efficiencies and improved the quality of deliverables, according to Cohen. Based on an internal study, the team found users saved nearly 7 minutes per search when using Maps@SYD versus previous processes using the airport’s digital print room. When extended across the staff of 200 accessing Maps@SYD, this could save over 5,000 person-hours annually if each person accessed the system once per day.
With more than 20,000 PDFs in the digital print room, users may still need to access and print individual drawings, but Maps@SYD is intended to provide a one-stop shop for most information. “Gone are the days of the operational staff fighting the elements with large paper plans,” noted Kim Cohen, Maps@SYD team lead. Next, click to view the Maps@SYD presentation and see how they have used this technology:
Common Threads
While the three finalists presented unique projects and approaches, Bentley Systems experts observed some common traits among the entrants. “The teams are curators of information, and they did the work themselves,” said Zubran Solaiman, Bentley Systems’ director of product portfolio for digital cities.
“They had different starting points, but they all got inspired to use digital technology,” said Richard Vestner, Bentley Systems’ senior director in cities and campuses. He also noted that the projects reflect a new business model, where digital facilities information is used by a wide variety of people and “not just for owners anymore.”
With the burgeoning amount of information available to facility owners and other agencies, the use of digital technology is clearly key to managing the data and providing access to users. In different manners, the finalists in this category showed how some of these technologies can be leveraged to deliver positive outcomes for owners and other stakeholders.
In addition to the Facilities, Campuses, and Cities category, Going Digital Awards were presented in 11 other categories encompassing all forms of infrastructure projects and stages – from design, to construction, to operations. The projects in each category were judged by an independent panel of jurors, using criteria specific to each category.




Share This Post