With government agencies across the U.S. placing a greater emphasis on transportation equity, GIS tools are playing key roles in identifying and achieving equity goals. While definitions vary, transportation equity is generally intended to improve accessibility and safety of multiple travel modes, enabling more people to participate in socio-economic life. Agencies are using GIS technology to analyze the adequacy of various travel modes, map areas underserved by transportation systems, and work interactively with communities to develop improvement plans — while also leveraging GIS features to weather pandemic challenges.
The metropolitan area of Charlotte, N.C., has experienced firsthand how GIS technology can modernize transportation planning. With a rapidly growing population and a diverse mix of land uses and demographics, various agencies in the metropolitan area have been seeking ways to plan for future transportation systems that better serve the region. The region is expected to grow by 1.4 million people by 2045, an increase of more than 50%.
“With our region’s primary highways and roads already nearing medium to maximum capacity, this rapid growth calls for an alternative means of travel, aside from personal vehicles,” said Geraldine Gardner, executive director of the Centralina Regional Council, a public organization that coordinates regional government collaboration in the Charlotte area. “But currently, mobility options are limited, and not many of them are not regionally coordinated.”
Combining Efforts
To address multiple transportation needs in the booming Charlotte area, Centralina, working with the Charlotte Area Transit System (CATS) and other agencies, developed CONNECT Beyond, a regional mobility plan that considered a slew of factors affecting transportation needs and how to address them. In addition to considering the region’s heavily burdened road and highway systems, the plan examined other transportation modes such as bus systems, rail transit, and pedestrian and bicycle facilities. The plan evolved partially from a previous plan called Connect our Future, which focused on land uses and how to manage transportation corridors and future growth within the region.
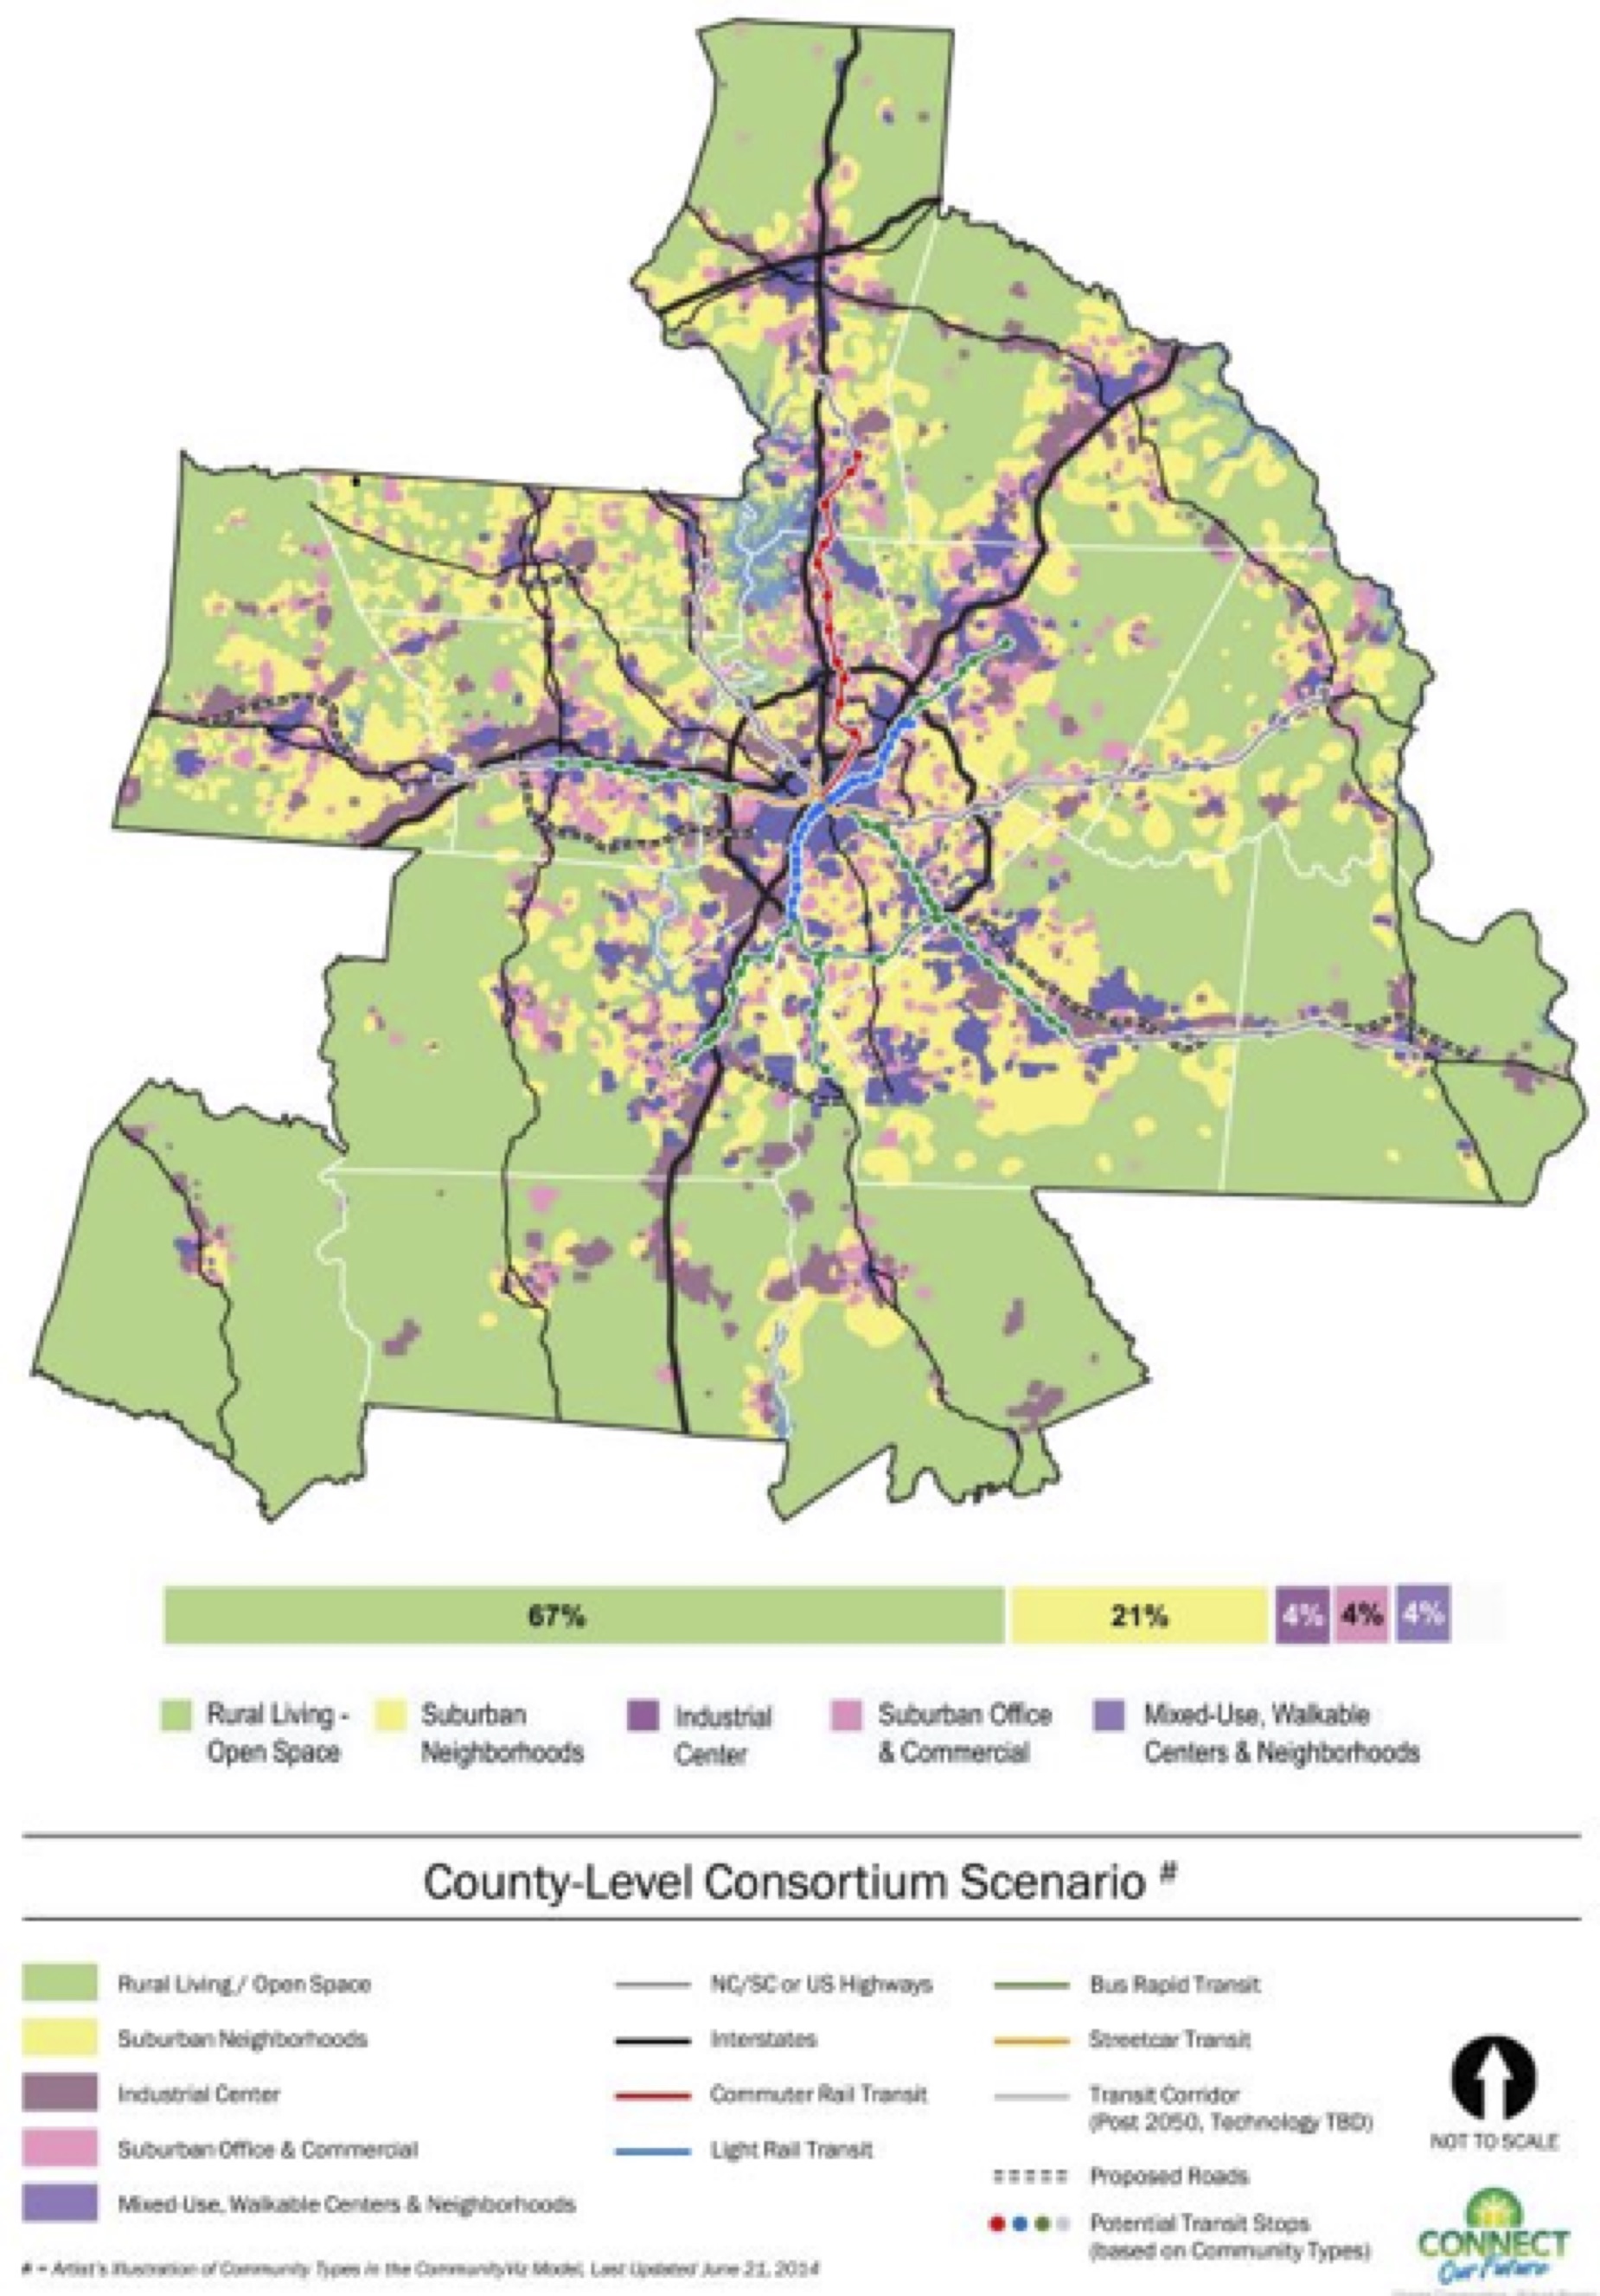
Land use analyses in the Charlotte region led to further focus on transportation equity. Image source: Centralina. Click image to enlarge.
Consultant HDR provided planning and GIS services in developing the CONNECT Beyond plan. The firm faced a gargantuan task in compiling data from multiple sources, gathering community input, and considering numerous demographic and socioeconomic factors in establishing equity parameters. The 12-county metropolitan area spans across 5,000 square miles, extending into South Carolina and including 17 different transit providers. Land uses vary widely, ranging from urban Charlotte to suburban and rural communities.
“There was no single thing that could address equity overall,” said Jorge Luna, HDR’s South Atlantic area transit lead and CONNECT Beyond project manager. “[To tackle the task], we wanted to create a GIS and have the project team and stakeholders understand where the greatest need for mobility services are.”
Pandemic-complicated kickoff
Early on in the project, HDR performed extensive community analytics to gather demographic and socioeconomic data, such as age, education, income, race, vehicle ownership, and access to jobs, schools, and healthcare facilities. Initial work in 2020 included numerous community interviews and meetings with stakeholder groups — a process complicated by the onset of COVID-19. With in-person meetings drastically limited, the team relied heavily on GIS technology to share information digitally.
“The intent of this project was to be very interpersonal, working directly with our clients, stakeholders, and the public,” said Bridget Wagner, HDR's East region GIS coordinator. “[When COVID-19 changed working conditions], we had to pivot to a digital deliverable, and GIS immediately lent itself to that end.”
GIS may have even aided efforts to emphasize equity, added Wagner. “The ability to use our design data, our conceptual information, all of that GIS technology to actually interact with our client and the public provided a more equitable approach by improving the access that everyone had to the project information. GIS always had a big role, but it became a larger role because of COVID,” she said.
The team used Esri ArcGIS Story Maps to introduce the project to clients, stakeholders, and the general public, creating a dynamic project review environment. The interactive approach allowed participants to provide feedback and help develop GIS data. For example, government agencies could advise of pending developments, or citizens could mark congestion points on a digital map. “We enabled them to start commenting, drawing on these applications and giving us information — crowdsourcing in a way, to get data we wouldn't have had otherwise,” noted Wagner.
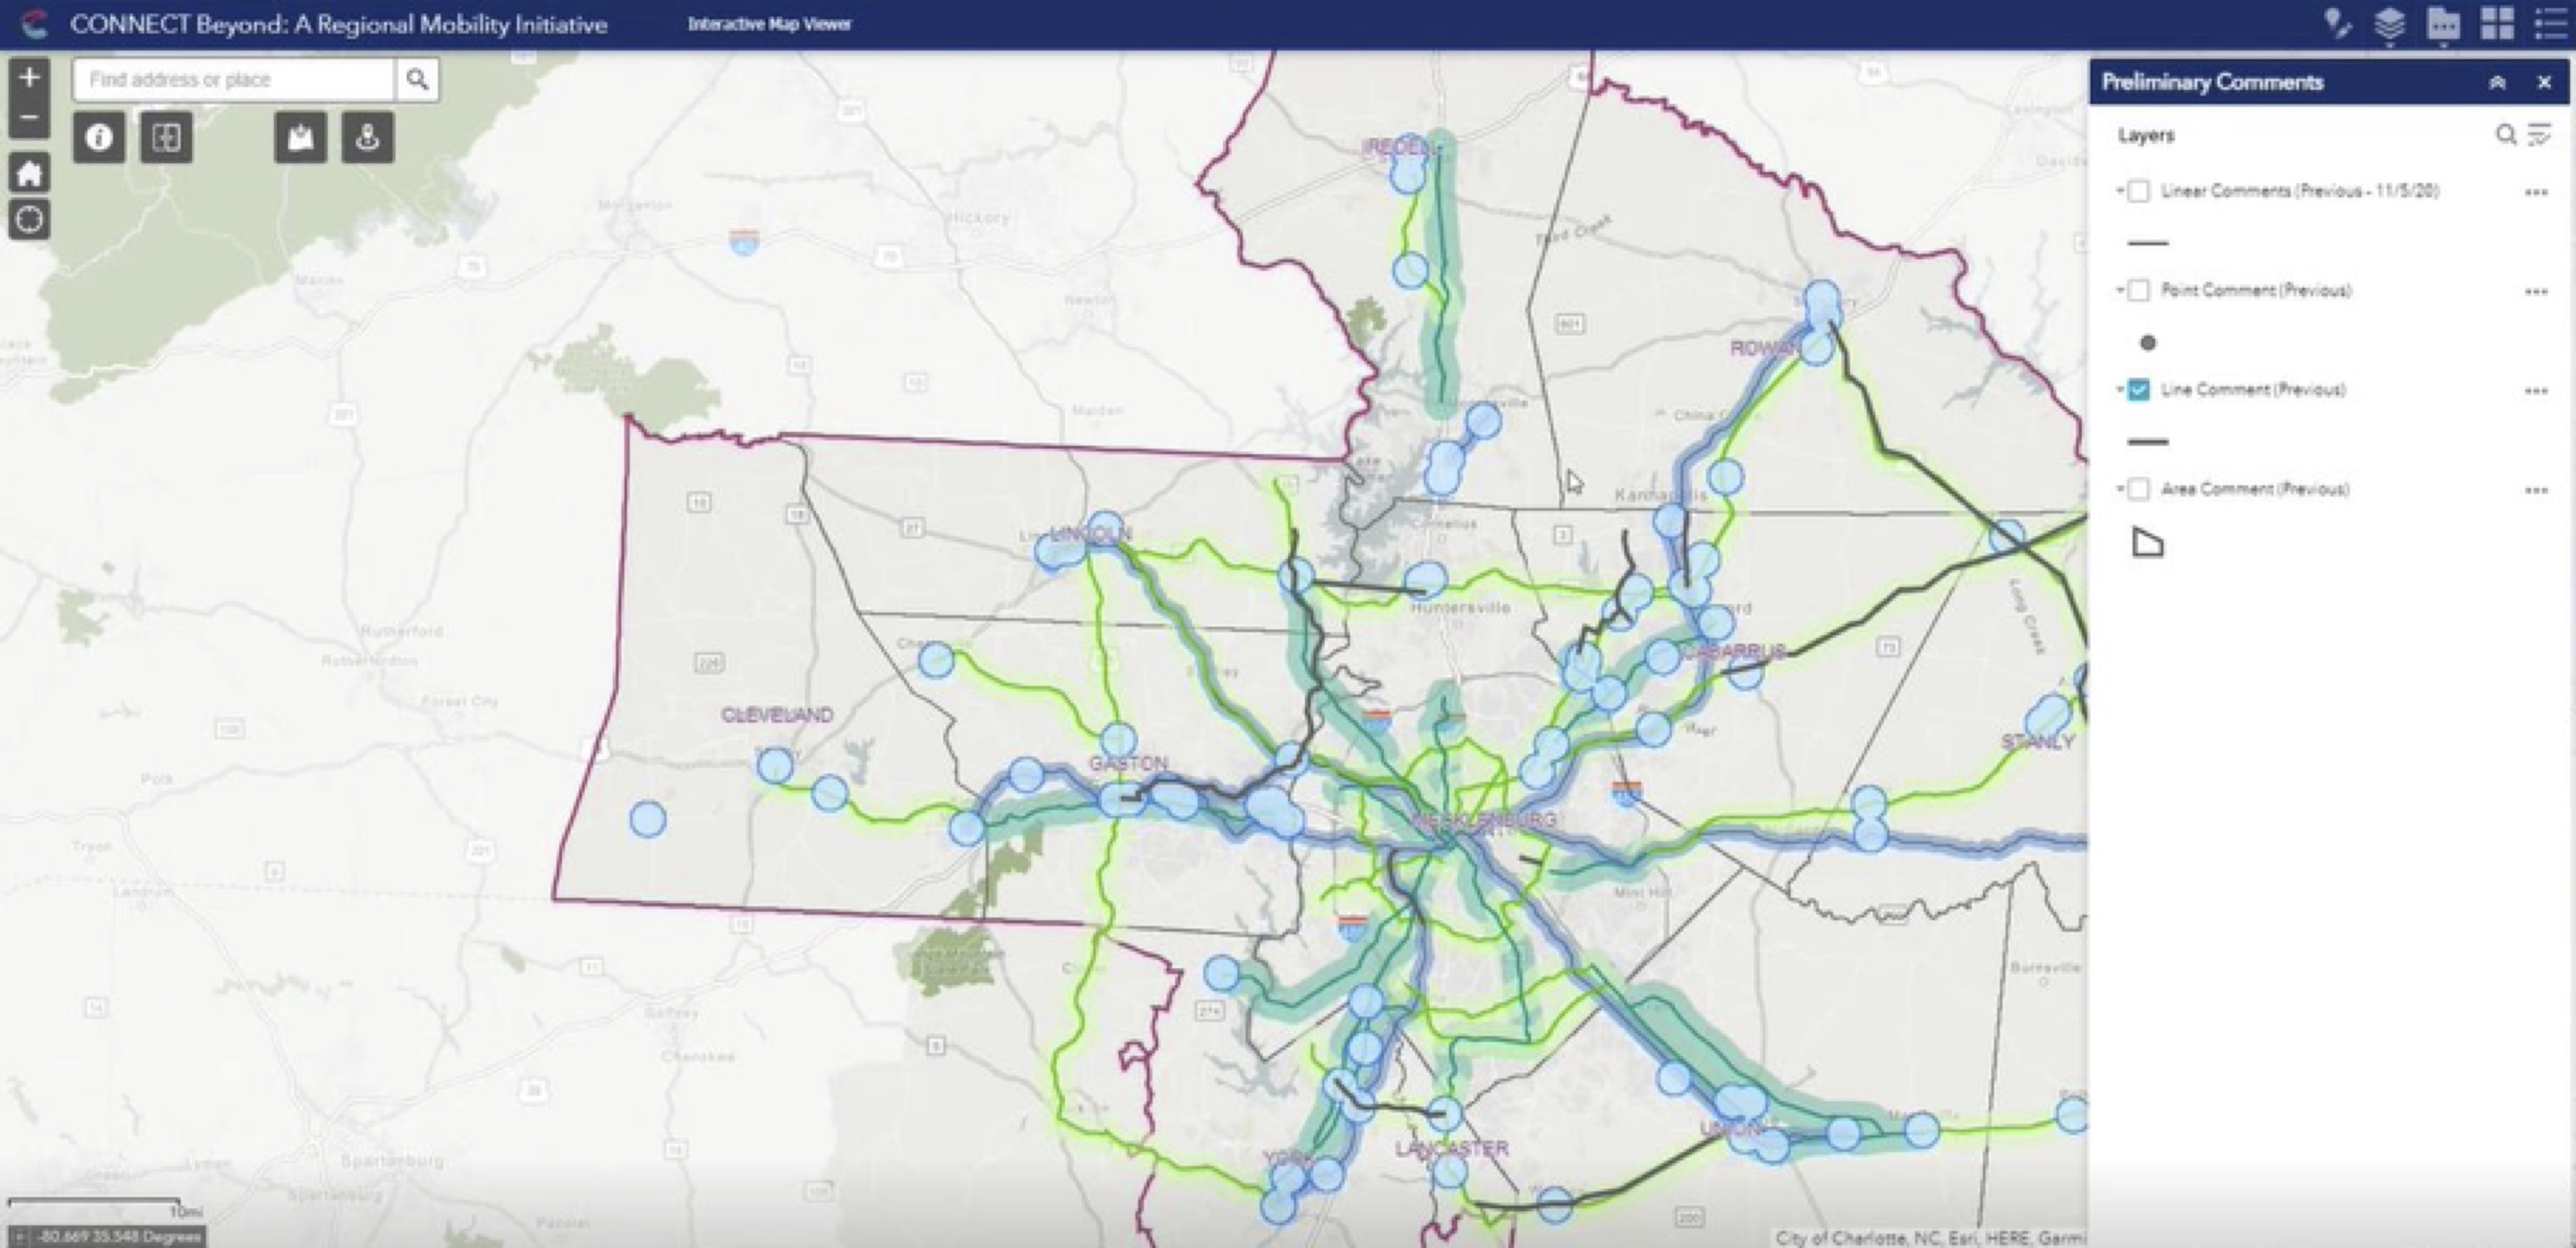
Interactive maps enabled stakeholders and the general public to provide feedback. Image source: Centralina. Click image to enlarge.
“[The interactive strategy] allowed the project team to start sketching ideas of what makes sense for a conceptual corridor to literally connect beyond the Mecklenburg County area,” noted Wagner. “We used GIS as that brainstorming tool to understand: Where are those pain points where people really don't have access? And, where do we need to improve that?”
Transit Propensity
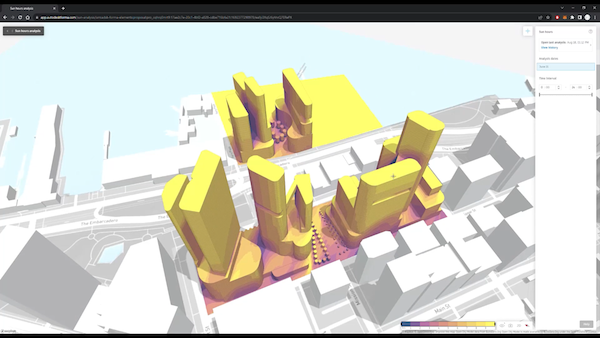
After gathering information, the HDR team used ArcGIS and other Esri tools to produce a transportation equity portal, enabling Centralina and other stakeholders to view data in various contexts. One of the key deliverables was a transit propensity map that identified where transit was needed, such as areas with lower percentages of drivers or areas with one or fewer vehicles per household.
“We looked at where individuals are located who may be in need of greater mobility services,” said Luna. “We wanted to create this resource to help guide the project team when identifying recommendations.”
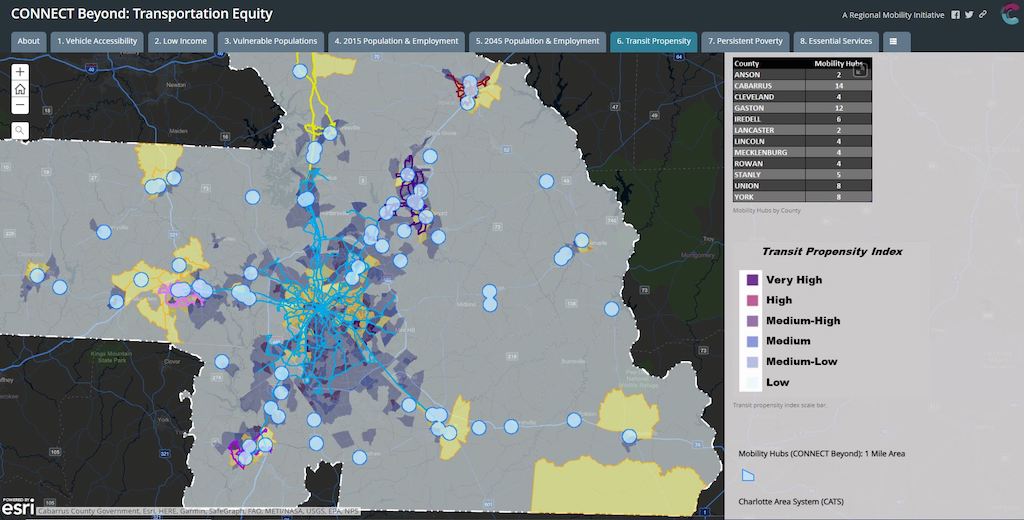
A transit propensity map identified where transit was needed. Image source: Centralina. Click image to enlarge.
To build the transit propensity map, the team developed a transit propensity index to rank areas according to their need for more transit services. The index was based on a scoring process that weighted various criteria across the region. The ability to quantify transit propensity and display it graphically on maps was a key to the project.
“You're looking at a massive area and trying to identify in the big picture what is equitable access and how are we defining that and what data are we using,” said Wagner. “The GIS piece really helped us identify where corridors needed to be, and it also added transparency to this project that might not have been there otherwise.”
Actions
Along with the transportation propensity analysis, CONNECT Beyond identified five areas for action, called Mobility Moves: create mobility-friendly places, expand mobility choices, strengthen rural to urban connections, build a better bus network, and invest in strategic corridors. Centralina’s Gardner views these as the building blocks to address transportation equity.
The plan also includes a database of recommendations for specific improvements, both long-term and short-term. The database is a living document that Centralina and other partners can modify over time, said HDR’s Luna.
“In the future if a community is trying to update a plan, this would be a living site for them,” said Luna. “We were able to set some quick wins with smaller tasks, such as studies, to keep momentum going on the project. There is a larger component that Centralina, CATS, and the rest of the regional organizations are shepherding together. You need to build support and find the resources to make some of the big capital investments happen. But the great thing is that there's continued communication and coordination between the various partners within the region.”
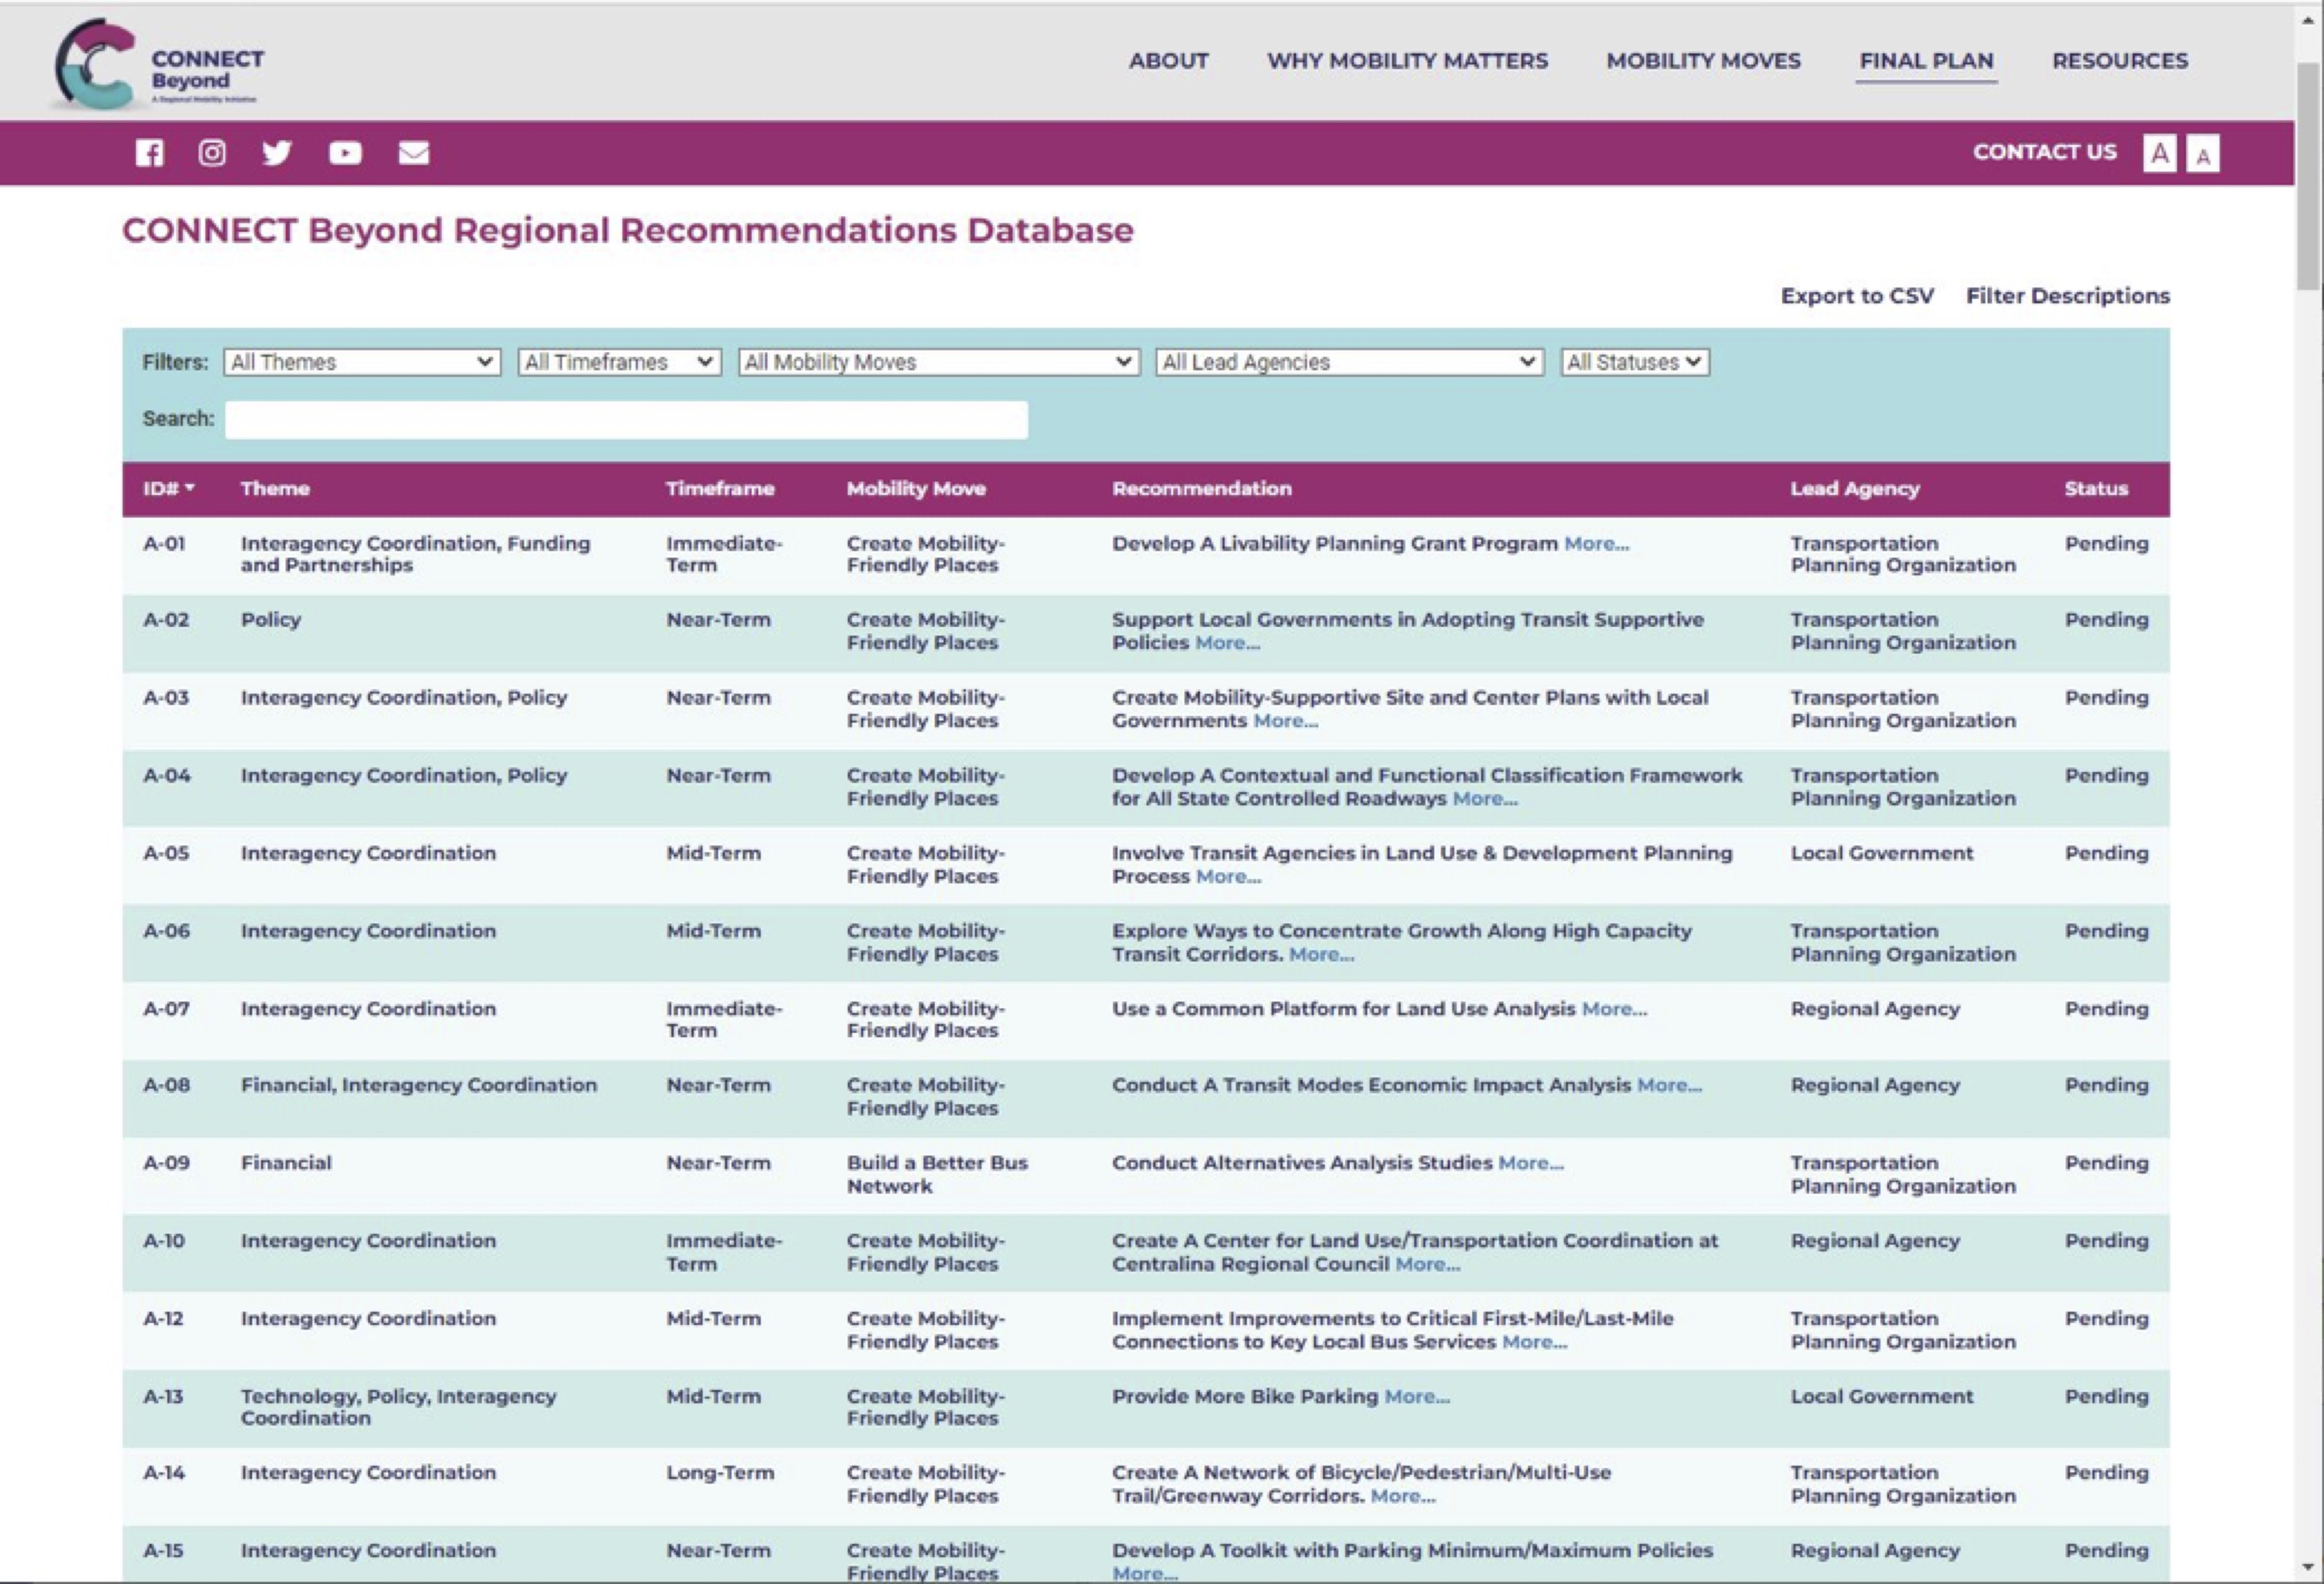
A recommendations database identified short- and long-term improvements. Image source: Centralina. Click image to enlarge.
Other Efforts
The transportation equity efforts in Charlotte are likely to become more common across the U.S., as funding from the $1.2 trillion Infrastructure Investment and Jobs Act rolls out and agencies seek to address equity issues, said Terry Bills, Esri’s global transportation industry director.
“Events of the last several years have really brought equity concerns across many fronts, whether it's transportation or social policies,” said Bills. He cites previous work in San Francisco, Oakland, Seattle, and Portland as successful efforts to, “redress and create more equitable transportation programs and projects.”
With distribution of IIJA funding still unfolding, Bills sees future work being guided by state departments of transportation. “The big allotments of federal dollars has to really come through the state departments of transportation and get pushed down to the cities.” At the local and regional levels, he states that, “[GIS technology can help agencies] deeply understand their community and more effectively compete for grants under the infrastructure bill.
To further support transportation equity efforts, Esri has partnered with Race Forward’s Government Alliance on Race and Equity (GARE) — a network of more than 400 city, county, and state government jurisdictions across the U.S. Esri worked with GARE and five of their member jurisdictions to collaborate on the ArcGIS Social Equity Analysis solution, a set of spatial decision making tools for governments seeking to address inequities in their communities.
The planning efforts in Charlotte and other cities might just be the start of a large wave of transportation work with a different focus than projects of the past — one aiming to meet the needs of previously underserved groups. GIS technology is likely to be front and center as agencies contemplate future transportation systems.


Share This Post